


Why is Fuel Poverty Rising in Rural England Post-Pandemic?
Millie Thomas

It is no secret that energy costs in England have risen since world economies reopened in the summer of 2021, exacerbated by hostilities between Russia and Ukraine(2). Faced with higher energy prices, the average household annual energy bill for typical consumption will be £1,928—up 59% since winter 2021 when most COVID-19 restrictions were lifted(3). Over 36% of households spent more than a tenth of their income after housing costs on energy last year, compared with 20.5% back in 2021(4)(5). Unsurprisingly, this has squeezed household budgets, pushing vulnerable families into fuel poverty.
Such statistics reveal a reversal from a long-running trend of the fuel poverty rate—the proportion of households in fuel poverty in England—declining from 22% in 2010 to 13.4% in 2019. This drop was achieved through energy efficiency improvements, among other factors, leading the fuel poverty rate to stabilise around 13%, even with high fuel costs(6). What is seemingly secret, however, is how this varies across England. Examining post-pandemic data by rurality reveals surprising results: the fuel poverty rate is still falling in urban areas but increasing in rural areas.
This article delves into investigating why this is the case, and what can be done to better understand and alleviate fuel poverty.
Fuel Poverty Overview
Fuel poverty is when a household lives in a property with a fuel poverty energy efficiency rating (FPEER) of band D or below, and has a residual income below the poverty line after necessary energy expenditure. Properties rated band D or below are considered energy inefficient, meaning more energy is required to maintain a reasonable temperature.
The income threshold, calculated as 60% of after housing costs (AHC) median income, was £17,291 in 2022. Households are below this if their AHC equivalised income (earnings from work/benefits, subtracting rent/mortgage payments, then adjusted to account for dependents) minus equivalised fuel costs (modelled energy requirements for heating, hot water, lights/appliances, and cooking, adapted for property size and occupants, then matched with corresponding fuel prices) is less than this figure.
For example, a household with AHC equivalised income £14,755, equivalised fuel costs £2,321, and a FPEER rating in band E would be classed as ‘fuel poor.’ This is because property is in a band below D, and the household AHC equivalised income - equivalised fuel costs equals £12,434; lower than the income threshold of £17,291.
The government measures fuel poverty using the Low Income Low Energy Efficiency (LILEE) indicator in England(7). In 2022, an estimated 3 million households were in fuel poverty in England(8).

The fuel poverty rate measures the proportion of households in fuel poverty, and the fuel poverty gap measures the depth of fuel poverty experienced by impacted households. While the fuel poverty rate has held stable over time, the fuel poverty gap skyrocketed to £325 in 2022, reversing a long-running decline. Provisional data for 2023 estimate this figure at £417, indicating the average fuel poor household would need a £417 reduction on energy costs to escape fuel poverty(10).
The Rural-urban Divide
Nonetheless, the level of fuel poverty experienced varies significantly between areas: falling in urban areas but increasing in rural areas, despite the fact that rural households are on average richer: median AHC equivalised incomes in urban regions were £26,118 in 2022, versus £31,257 in rural/semi-rural regions(11).
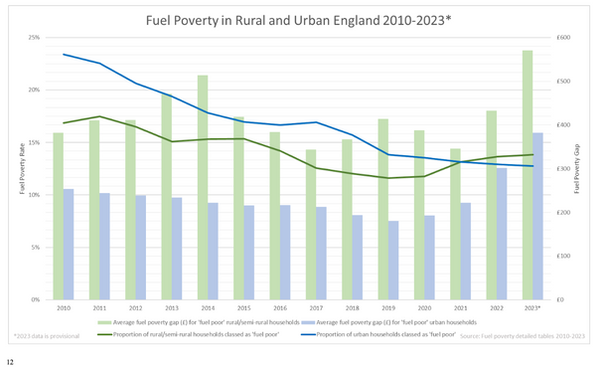
Fuel poverty results did not always run counter-trend. As seen in the graph, fuel poverty rates were historically lower in rural areas. But this changed in 2021: the urban fuel poverty rate declined from 13.1% to 12.8% in 2023, whereas it increased from 13.1% to 13.8% in rural areas. The urban and rural fuel poverty gaps follow a similar trend however, with the latter consistently higher. This can be attributed to significantly higher energy requirements to heat rural homes, intensifying the financial burden endured by those in fuel poverty. For instance, in 2022 the average rural fuel-poor household needed £131 more than the average urban fuel-poor household to escape fuel poverty. This is significant given 17.2% of citizens live in a rural/semi-rural area in England(13).
Explaining the Rural-urban Divide
So why is fuel poverty suddenly rising in rural areas but not in urban areas?
Energy-efficiency Differences
Firstly, rural properties are less energy-efficient on average. The median FPEER, an energy efficiency rating, was 69 (band C) for urban houses, but only 64 (band D) for rural houses in 2022(14). Fuel poverty means the household’s dwelling must belong in a band D or below(15). As the chart shows, a larger proportion of rural homes fell in the lowest bands, meaning they are more likely to be in fuel poverty(16).
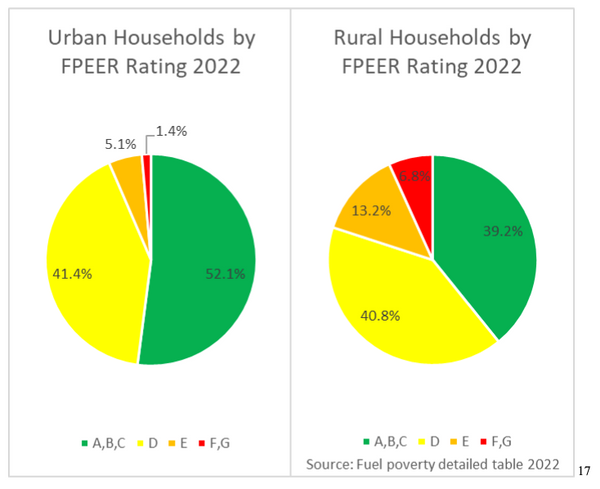
The lower the band a household belongs to, the greater the chance of fuel poverty — 33% of those in bands F and G in 2022 were in fuel poverty(18).
But why has this increase occurred now, post-pandemic?
Changes in the proportion of households in each FPEER band for rural and urban areas have been almost identical in recent years, so it must be a result of higher energy bills disproportionately impacting energy-inefficient households. Between 2021-23, median equivalised fuel costs rose by £1,698 for households in F and G, but only £741 for those in A, B, or C(19).

Rural properties tend to be older, larger, and detached. Poor insulation, greater floor area, and more exposed walls contribute to the lower energy efficiency of houses and higher likelihood of fuel poverty(21). For example, rural residences are more likely to have been built pre-1919, which are shown below to experience the highest fuel poverty rate(22).

Rural households might typically have higher income, but higher energy bills counteract this. Detached households had median AHC equivalised income 64% higher than purpose-built flats in 2022 but experienced the greatest increase in median equivalised fuel costs of any property type, at 28.9% 2021-22. Conversely, purpose-built flats only saw a 17.8% rise in the same period(24). This will cause more households to fall into fuel poverty, despite their larger income.
Infrastructure Networks and Alternative Energy Source Dependency

Secondly, poor connectivity to infrastructure networks is another detriment of rural living. 1 in 4 properties in predominantly rural areas were off the gas grid, compared with 11% in predominantly urban areas in 2021. This means rural households frequently rely on alternative fuels such as heating oil, liquefied petroleum gas (LPG), and coal(26). 19.5% of off-grid households found themselves in fuel poverty in 2022, rising slightly from before the pandemic(27).
Off-grid homes tend to experience a greater fuel poverty rate simply due to larger costs as heating oil prices are not capped like gas and fluctuate more. Median AHC equivalised income between off-grid and on-grid residences is similar, but median equivalised fuel costs were 26% higher in 2022. These dwellings also had a lower median FPEER contributing to greater costs(28).
Purchasing behaviour is also different as alternative fuels are bought upfront in large quantities. Volatile prices mean households may find themselves paying more or less than market price at time of use(29). This might have led to a higher rural fuel poverty rate if consumers’ oil purchases were ill-timed. Insufficient connectivity is another aspect which, combined with poor energy efficiency, can exacerbate a household’s vulnerability to fuel poverty.
Elderly Population and Income
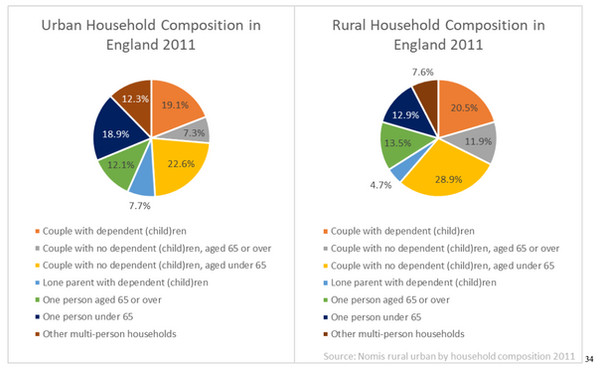
Finally, rural areas have a larger proportion of people over 65 years of age(30). Between 2020 and 2023, the largest rise in fuel poverty occurred for households composed of one-person aged 60+, growing 33%(31_. Their income, costs, energy efficiency, and floor area are roughly average compared to other household compositions, possibly suggesting more middle-income households have been pushed into fuel poverty post-pandemic. Additionally, households consisting of a couple with no dependent children, aged 60+ saw a 17.6% increase in the fuel poverty rate in the same period(32). They accounted for 11.9% of rural households but only 7.3% of urban households in the 2011 census(33).

Findings from employment and income data also confirm these trends. A 23.7% rise in the fuel poverty rate was witnessed in retired households between 2021-23(36). Retirees accounted for 28% of the rural population last year; higher than 19.6% for urban areas(37). Median AHC equivalised income for retired households only rose 4.8% between 2021 and 2023, contrasting with the household average of 9.2%. Escalating fuel costs dragged additional households into fuel poverty(38).
The greatest relative change in fuel poverty rate from 2021 was for households in the 3rd/4th AHC equivalised income deciles, increasing 32%(39), supporting the case that post-pandemic fuel price surges pushed extra middle-income households into fuel poverty.

Conclusion
In summary, the rising fuel poverty rate witnessed in rural areas of England after pandemic restrictions were eased in 2021 may be predominantly attributed to rising fuel costs.
Higher energy bills pushed more rural households into fuel poverty as those properties are less energy-efficient on average. This is a product of their older age, detached form, and larger size. These factors increase energy requirements to suitably heat homes and, when examined independently, also explained rising fuel poverty rates post-pandemic.
Rural households may have greater median incomes to counteract greater costs, but more frequently have older, retired inhabitants. Amid higher inflation, their income growth has fallen short of that experienced by other households, explaining why the fuel poverty rate notably grew for this group. Furthermore, there is potential evidence suggesting more middle-income households have fallen into fuel poverty recently. Their larger properties increase vulnerability to energy price shocks. Dependence on alternative fuels with unstable prices furthers this household susceptibility.
Eliminating fuel poverty is critical as living in a cold house can heighten your risk of heart attack or stroke, respiratory illnesses, and mental health conditions(41). The NHS spends over £2.5 billion every year treating sicknesses connected to residing in a cold property, and estimates suggest 10% of excess winter deaths may be attributable to fuel poverty(42)(43). These repercussions are arguably more severe for rural households given the vulnerability of older people to health problems(44). Ending this rising trend of fuel poverty can prevent deteriorating health, improve quality of life, and bridge regional inequalities.
References
-
Personal photo taken
-
https://commonslibrary.parliament.uk/research-briefings/cbp-9714/
-
https://commonslibrary.parliament.uk/research-briefings/cbp-9714/
-
https://www.gov.uk/government/collections/fuel-poverty-statistics
-
https://www.gov.uk/government/collections/fuel-poverty-statistics
-
https://www.gov.uk/government/collections/fuel-poverty-statistics
-
https://www.gov.uk/government/collections/fuel-poverty-statistics
-
https://www.gov.uk/government/statistics/fuel-poverty-supplementary-tables-2024-2022-data
-
https://www.gov.uk/government/collections/fuel-poverty-statistics
-
https://www.gov.uk/government/collections/fuel-poverty-statistics
-
https://www.gov.uk/government/collections/fuel-poverty-statistics
-
https://www.gov.uk/government/statistics/fuel-poverty-detailed-tables-2024-2022-data
-
https://www.gov.uk/government/statistics/fuel-poverty-detailed-tables-2024-2022-data
-
https://www.gov.uk/government/collections/fuel-poverty-statistics
-
https://www.gov.uk/government/collections/fuel-poverty-statistics
-
https://assets.publishing.service.gov.uk/media/65ef7140133c220019cd37d2/2_Housing_12_03_2024.pdf
-
https://www.gov.uk/government/statistics/fuel-poverty-detailed-tables-2024-2022-data
-
https://www.gov.uk/government/collections/fuel-poverty-statistics
-
https://www.gov.uk/government/statistics/fuel-poverty-trends-2024
-
https://assets.publishing.service.gov.uk/media/65ef679e133c220019cd37d0/8_Energy_12_03_2024.pdf
-
https://www.gov.uk/government/statistics/fuel-poverty-detailed-tables-2024-2022-data
-
https://www.gov.uk/government/statistics/fuel-poverty-supplementary-tables-2024-2022-data
-
https://researchbriefings.files.parliament.uk/documents/CBP-9838/CBP-9838.pdf
-
https://assets.publishing.service.gov.uk/media/642570153d885d000fdadf17/1_-_Population_v2.pdf
-
https://www.gov.uk/government/statistics/fuel-poverty-trends-2024
-
https://www.gov.uk/government/statistics/fuel-poverty-supplementary-tables-2024-2022-data
-
https://www.nomisweb.co.uk/census/2011/QS113EW/view/2092957699?rows=rural_urban&cols=c_hhchuk11
-
https://www.nomisweb.co.uk/census/2011/QS113EW/view/2092957699?rows=rural_urban&cols=c_hhchuk11
-
https://www.gov.uk/government/statistics/fuel-poverty-trends-2024
-
https://www.gov.uk/government/collections/fuel-poverty-statistics
-
https://www.gov.uk/government/collections/fuel-poverty-statistics
-
https://www.gov.uk/government/collections/fuel-poverty-statistics
-
https://www.gov.uk/government/collections/fuel-poverty-statistics
-
https://researchbriefings.files.parliament.uk/documents/CBP-8730/CBP-8730.pdf